


Citywide Shifts in Tenure
If New York City were a theater, the owner-occupied cast got a modest encore while renters kept filling seats.
Census ACS 5-Year Estimates reveal 104,253 new owner-occupied homes and 133,904 new renter-occupied homes between 2014 and 2024.
The citywide owner-occupied share nudged up from 32% to 33%, a one-point rise that feels like a quiet applause.
Borough Battles
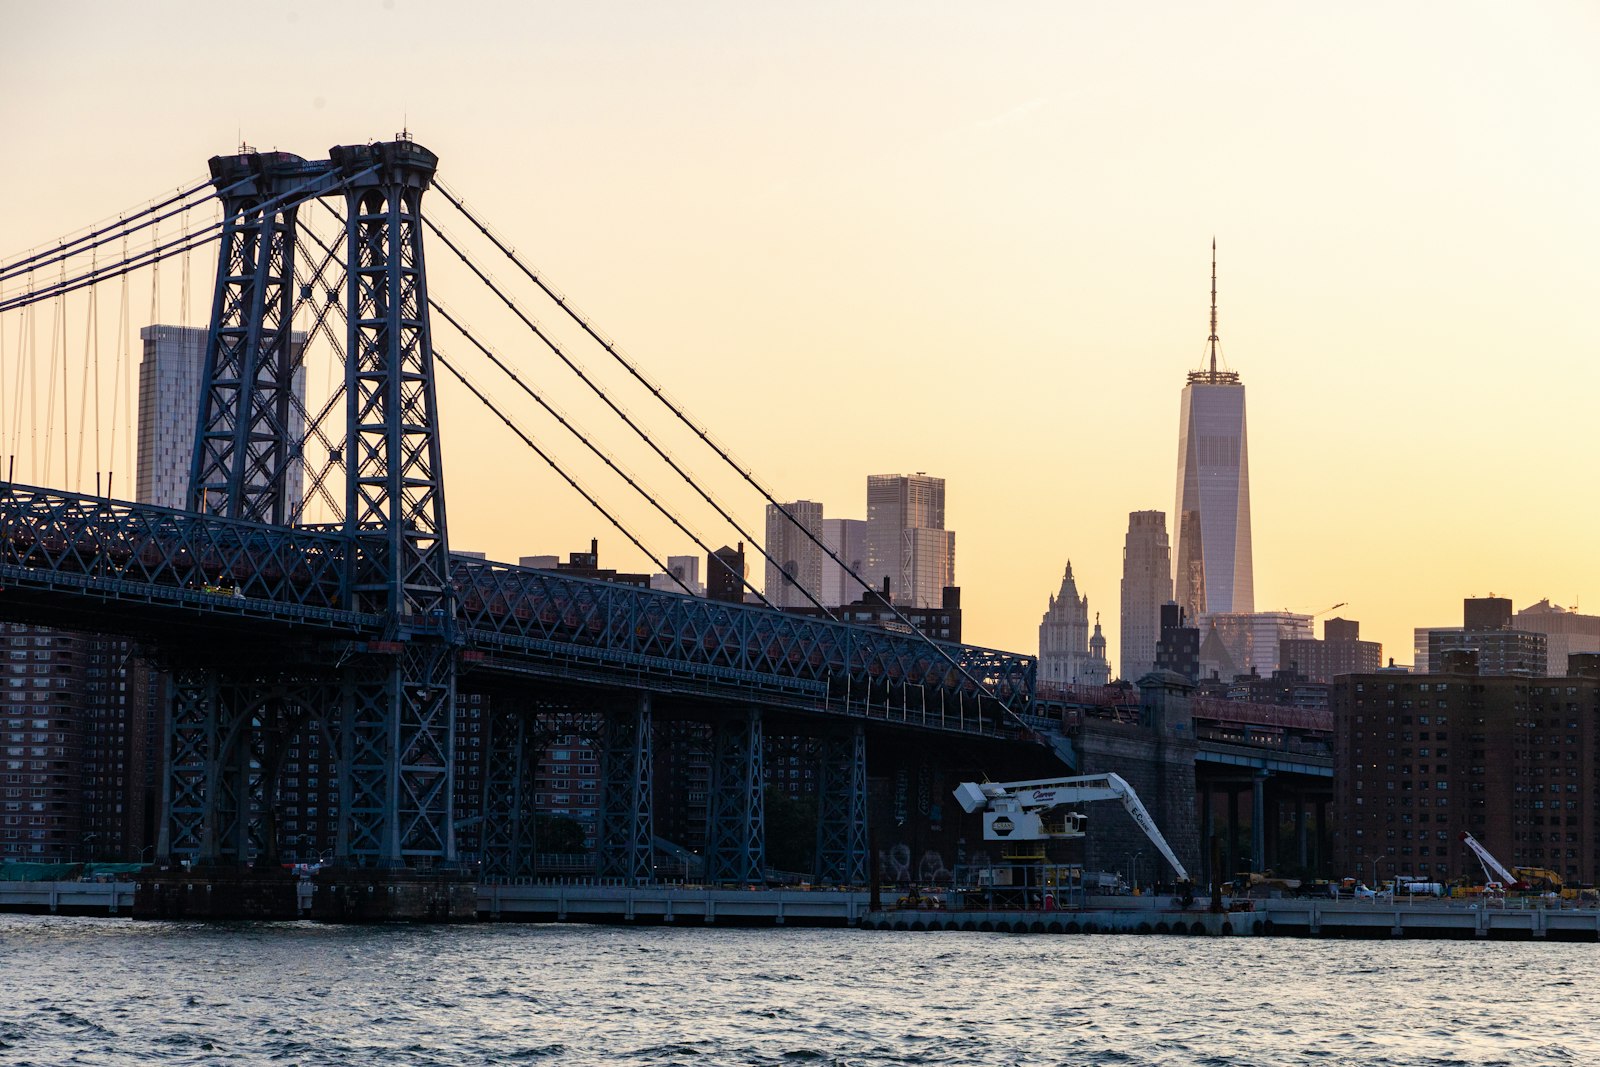
Manhattan led the charge, lifting its owner-occupied share from under 23% to 25%, the biggest percentage jump of any borough.
The borough added roughly 26,600 owner-occupied units and about 6,600 rental units, a ratio that would make a mathematician smile.
Queens contributed the most owner-occupied units, 35,400, pushing its owner share to 45%, a solid middle-of-the-road performance.
Brooklyn saw about 85,000 occupied units added, yet its 30/70 owner-renter split held steady, proving size doesn’t always shift ratios.
Staten Island was the lone outlier, with its owner share slipping from 69% to 68%, a tiny dip that still matters to locals.
Neighborhood Spotlights
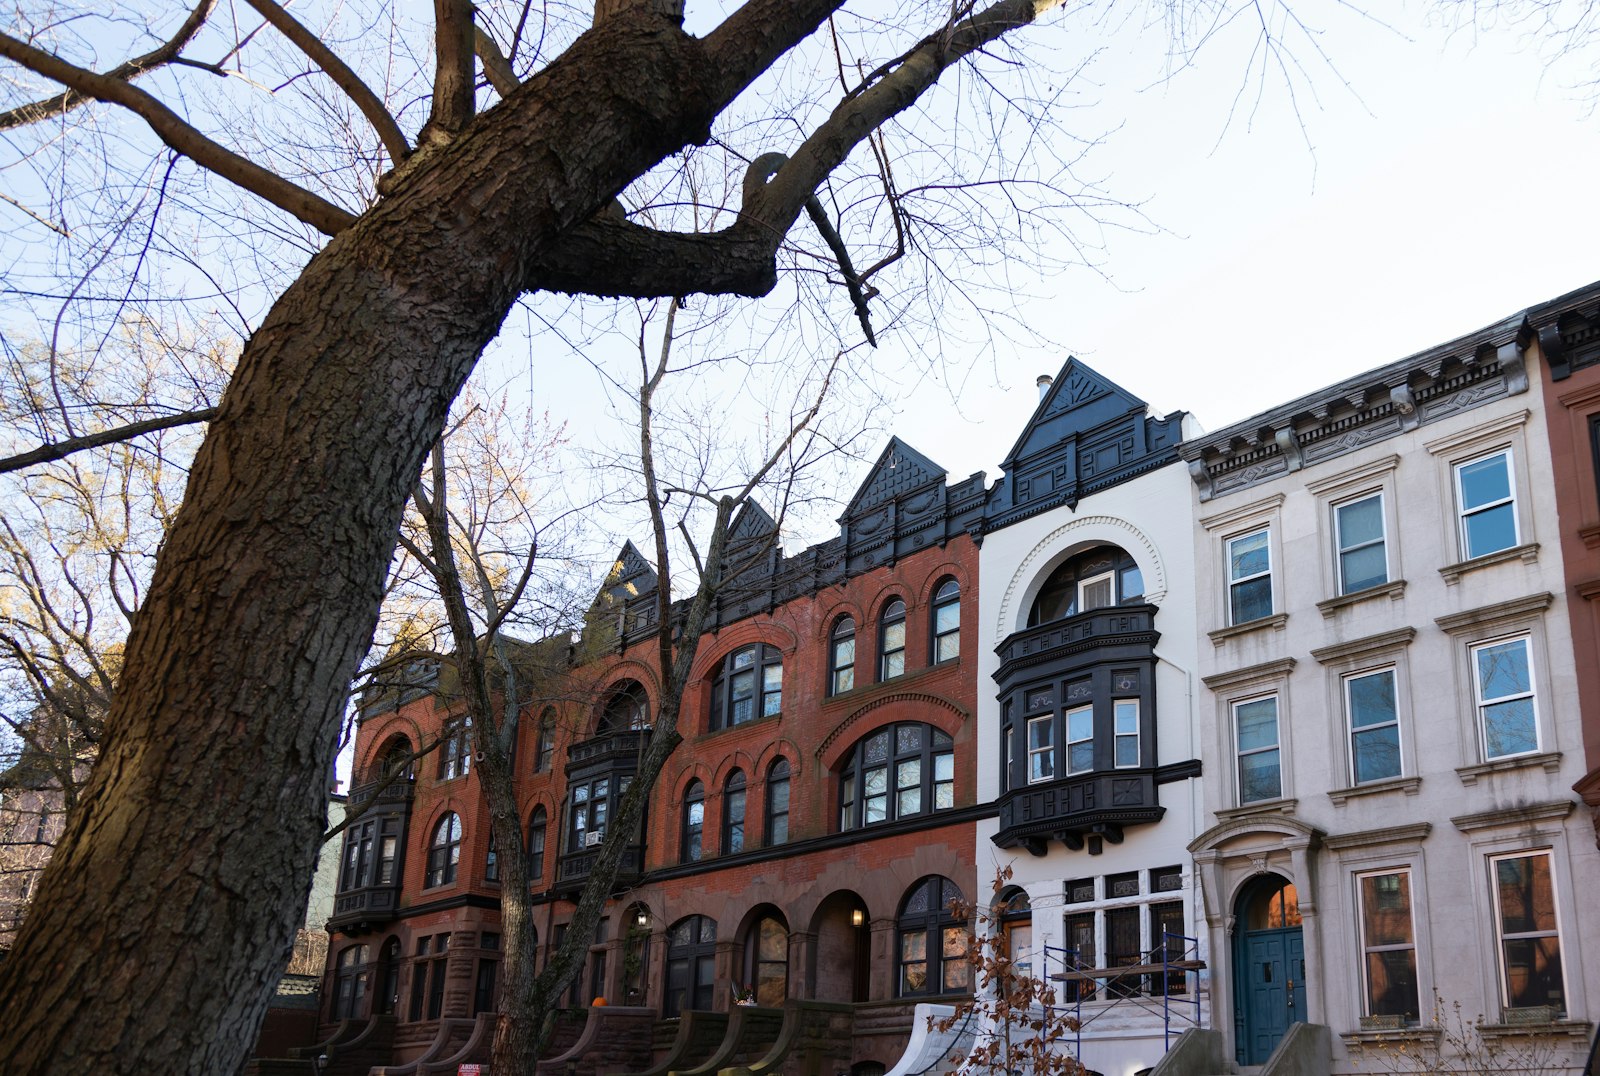
Battery Park City’s owner share jumped 11 points, climbing from 19% to 30%, a transformation that would make a real-estate agent raise an eyebrow.
Civic Center topped the list with an 18-point surge to 40% owner share, a rise that feels like a neighborhood makeover.
Cobble Hill, Vinegar Hill, DUMBO and Greenwood Heights each added more than 7 percentage points to their owner percentages, turning the tide in traditionally renter-heavy zones.
Even with all the gains elsewhere, the overall owner-occupied growth of 11% still trails the 6% rise in renter-occupied homes, reminding us that numbers tell nuanced stories.
Overall, the data paints a picture of a city where both owners and renters continue to expand their footprints, each carving out space in the ever-dense urban puzzle.
Questions
Did owner-occupied homes increase in number more than renter-occupied homes from 2014 to 2024?
No. Renter-occupied homes added 133,904 units, while owner-occupied homes added 104,253 units during the same period.
Which borough added the most owner-occupied homes?
Queens added the most owner-occupied homes, with 35,400 new units between 2014 and 2024.
Did any borough see its owner-occupied share decline?
Yes. Staten Island’s owner-occupied share fell from 69% to 68%.
More from Sarah Cotty: buying a home, selling a home, and the market journal.